|
|
|
说明:双击或选中下面任意单词,将显示该词的音标、读音、翻译等;选中中文或多个词,将显示翻译。
|
|
|
1) a-p-d curve

a-p-d曲线
2) P-D-εcurve
P-D-ε曲线
3) a-b curves and p-d curves
a-d曲线和p-d曲线
4) p-t curve
p-t曲线
1.
Method of reliability evaluation for P-T curve based on multi-sample time series analysis;
多样本时间序列的P-T曲线可靠性评估方法
2.
Influence of Firing-Circuitry Polarity to Igniter P-t Curve;
点火线路对点火装置P-t曲线的影响
5) P-I curve
P-I曲线
1.
Three kindsof P-I curve kink from the high-speed LD , w hich c an be able to be displayed in LD test, have been reported and analyzed in this paper.
报告和分析了高速激光器组件中可能出现的3种P-I曲线扭折;指出了在驱动电流20~40mA、光功率0。
6) p-s curve
p-s曲线
1.
Simulation and analysis of the equivalent law of work of P-s curve of anchor pile;
锚杆P-s曲线的功能互等定律法的模拟与分析
2.
According to the grey theory,the author attempts to predict both t-s and P-S curves of the test and obtain the similar settlement which traditionally gained by slow load test.
探讨了灰色理论方法在快速法载荷试验数据处理中的应用,并运用此理论对快速载荷试验各级荷载下的t-s曲线及总体的P-S曲线进行预测,以得到荷载作用下与慢速法一致的稳定沉降量。
3.
By using the data of pull-out tests of anchor rod,we have discussed the use of the nonequidistance GM(1,1)model for simulating the P-S curve of anchor rod and predicting the ultimate capacity of anchor rod,in the same time,we also discussed if we can predict the ultimate capacity of anchor rod by using the data of anchor rod pull-out tests before breakage.
结合锚杆抗拔试验数据,探讨了不等间距GM(1,1)模型拟合锚杆P-S曲线以及预测锚杆极限承载力的效果,同时分析了利用未破坏锚杆实测数据预测锚杆极限承载力的效果。
补充资料:Autocad VBA初级教程 (第五课 画函数曲线)
先画一组下图抛物线。 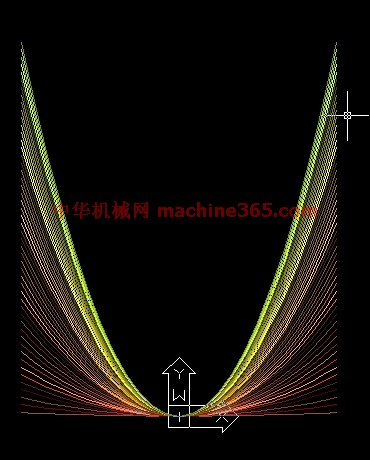
下面是源码:
Sub myl()
Dim p(0 To 49) As Double '定义点坐标
Dim myl As Object '定义引用曲线对象变量
co = 15 '定义颜色
For a = 0.01 To 1 Step 0.02 '开始循环画抛物线
For i = -24 To 24 Step 2 '开始画多段线
j = i + 24 '确定数组元素
p(j) = i '横坐标
p(j + 1) = a * p(j) * p(j) / 10 '纵坐标
Next i '至此p(0)-p(40)所有元素已定义,结束循环
Set myl = ThisDrawing.ModelSpace.AddLightWeightPolyline(p) '画多段线
myl.Color = co '设置颜色属性
co = co + 1 '改变颜色,供下次定义曲线颜色
Next a
End sub
为了鼓励大家积极思考,从本课开始,我不再解释每一条语句的作用,只对以前没有提过的语句进行一些解释,也许你一时很难明白,建议用上一课提到的跟踪变量、添加断点的办法领悟每一条语句的作用,如果有问题不懂请跟贴提问。
在跟踪变量p时请在跟踪窗口中单击变量p前的+号,这样可以看清数组p中每一个元素的变化。 ACAD没有现成的画抛物线命令,我们只能用程序编写多段线画近似抛物线。理论上,抛物线的X值可以是无限小、无限大,这里取值范围在正负24之间。 程序第二行:Dim myl As Object '定义引用曲线对象变量
Object也是一种变量类型,它可以把变量定义为对象,本例中myl变量将引用多段线,所以要定义为Objet类型。 看画多段线命令:
Set myl = ThisDrawing.ModelSpace.AddLightWeightPolyline(p) '画多段线
其中括号中的p是一个数组,这个数组的元素数必须是偶数,每两个元数作为一个点坐标。
等号前面部分“Set myl”的作用就将myl变量去引用画好的多段线。
myl.Color = co '设置颜色属性。在ACAD中,颜色可以用数字表示,本例中co会增值,这样就会有五彩缤纷的效果。 本课第二张图:正弦曲线,下面是源码:
Sub sinl()
Dim p(0 To 719) As Double '定义点坐标
For i = 0 To 718 Step 2 '开始画多段线
p(i) = i * 2 * 3.1415926535897 / 360 '横坐标
p(i + 1) = 2 * Sin(p(i)) '纵坐标
Next i
ThisDrawing.ModelSpace.AddLightWeightPolyline (p) '画多段线
ZoomExtents '显示整个图形
End Sub
说明:补充资料仅用于学习参考,请勿用于其它任何用途。
参考词条
|