|
|
|
说明:双击或选中下面任意单词,将显示该词的音标、读音、翻译等;选中中文或多个词,将显示翻译。
|
|
|
1) p-y curves

p-y曲线
1.
Nonlinear finite element analysis of piles under lateral load based on P-Y curves;

基于P-Y曲线法的水平受荷桩非线性有限元分析
2.
Experimental research on silt p-y curves

粉土p-y曲线的试验研究
3.
Based on the experimental results,the p-y curves of soft clay for static loading derived by WR method were compared with the API recommended ones.
将利用加权残值法得到的p-y曲线与API建议的软粘土p-y曲线进行了比较,并根据试验数据用折减系数法对API建议的软粘土p-y曲线进行了修正。
2) P~Y curves

P~Y曲线
3) p-y curve

p–y曲线
4) p-y method

p-y曲线法
1.
The p-y method employed in this article was applied to the calculation of bridge pile foundations.
将p-y曲线法用于桥梁桩基础计算的结果,与试验结果比较证明该方法的合理性,与m法对比分析以指出m法存在的不足。
2.
The lateral deflections of single pile and pile groups are computed by the p-y method and the computation results agreed well with test results.
应用p-y曲线法计算了单桩和群桩的水平位移,计算结果与实测值接近。
5) p-y curve method

p-y曲线法
1.
It is common to use the nonlinear load-transfer method(p-y curve method) or Poulos′s elastic theory to calculate piles subjected to lateral soil movements at present.
目前,分析侧向土体位移作用下桩基的性状时多采用非线性荷载传递法(p-y曲线法)和Poulos弹性理论法。
2.
The p-y curve method with the advantage which the non-linear and large deformation of the soil can be taken into account,becomes the main method in the analysis of laterally loaded piles.
p-y曲线法因其能考虑土体非线性和大变形特性,成为海洋工程中分析侧向受荷桩的主要方法。
3.
To solve this problem,the influence of bridge pile foundation under embankment load based on p-y curve method was analyzed.
针对这一问题,本文基于p-y曲线法,就路堤堆载对邻近桥梁桩基的影响进行计算分析,其结果与二维有限元模拟结果的对比分析,表明本文提出的方法是可行的。
6) p–y curve

桩的p–y曲线
补充资料:Autocad VBA初级教程 (第五课 画函数曲线)
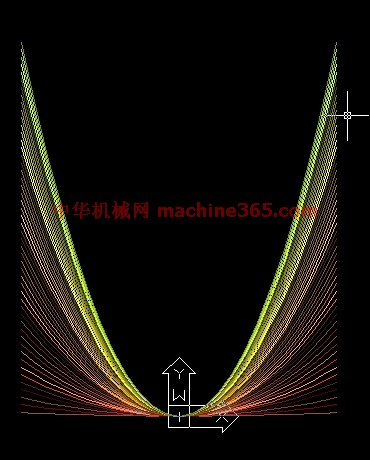
先画一组下图抛物线。 
下面是源码:
Sub myl()
Dim p(0 To 49) As Double '定义点坐标
Dim myl As Object '定义引用曲线对象变量
co = 15 '定义颜色
For a = 0.01 To 1 Step 0.02 '开始循环画抛物线
For i = -24 To 24 Step 2 '开始画多段线
j = i + 24 '确定数组元素
p(j) = i '横坐标
p(j + 1) = a * p(j) * p(j) / 10 '纵坐标
Next i '至此p(0)-p(40)所有元素已定义,结束循环
Set myl = ThisDrawing.ModelSpace.AddLightWeightPolyline(p) '画多段线
myl.Color = co '设置颜色属性
co = co + 1 '改变颜色,供下次定义曲线颜色
Next a
End sub
为了鼓励大家积极思考,从本课开始,我不再解释每一条语句的作用,只对以前没有提过的语句进行一些解释,也许你一时很难明白,建议用上一课提到的跟踪变量、添加断点的办法领悟每一条语句的作用,如果有问题不懂请跟贴提问。
在跟踪变量p时请在跟踪窗口中单击变量p前的+号,这样可以看清数组p中每一个元素的变化。 ACAD没有现成的画抛物线命令,我们只能用程序编写多段线画近似抛物线。理论上,抛物线的X值可以是无限小、无限大,这里取值范围在正负24之间。 程序第二行:Dim myl As Object '定义引用曲线对象变量
Object也是一种变量类型,它可以把变量定义为对象,本例中myl变量将引用多段线,所以要定义为Objet类型。 看画多段线命令:
Set myl = ThisDrawing.ModelSpace.AddLightWeightPolyline(p) '画多段线
其中括号中的p是一个数组,这个数组的元素数必须是偶数,每两个元数作为一个点坐标。
等号前面部分“Set myl”的作用就将myl变量去引用画好的多段线。
myl.Color = co '设置颜色属性。在ACAD中,颜色可以用数字表示,本例中co会增值,这样就会有五彩缤纷的效果。 本课第二张图:正弦曲线,下面是源码:
Sub sinl()
Dim p(0 To 719) As Double '定义点坐标
For i = 0 To 718 Step 2 '开始画多段线
p(i) = i * 2 * 3.1415926535897 / 360 '横坐标
p(i + 1) = 2 * Sin(p(i)) '纵坐标
Next i
ThisDrawing.ModelSpace.AddLightWeightPolyline (p) '画多段线
ZoomExtents '显示整个图形
End Sub
说明:补充资料仅用于学习参考,请勿用于其它任何用途。
参考词条
|


