1) environmental Gini coefficient


环境基尼系数
1.
By introducing Gini coefficient used in economics into environmental field,a new method of total pollutant load allocation in different areas of the same river was established using the new concept of environmental Gini coefficient.
将应用在经济领域的基尼系数引入环境领域,应用环境基尼系数这一新概念建立了一套新的流域内各区域间水污染物总量分配方法。
2.
To maximize the integrated economic,social and environmental benefits,a hierarchical model is developed for both qualitative description and quantitative analysis of the distribution of total water pollutants allowed to be discharged among the sub-areas of a lake basin by applying the environmental Gini coefficient to the distribution.
从经济、社会和环境系统整体效益出发,将环境基尼系数应用于总量控制分配中,分别以人口和工业增加值等作为湖泊流域内基尼系数分配的指标,建立了一种定性与定量相结合描述湖泊流域分区水污染物排放总量分配的层次结构模型。
2) resource-environment Gini coefficient


资源环境基尼系数
1.
Analysis of China resource-environment Gini coefficient based on GDP.;


基于GDP的中国资源环境基尼系数分析
3) resource-environment Gini coefficient(Gre)


资源环境基尼系数
1.
Yinbo Zhang considered that resource-environment Gini coefficient(Gre) was designed according to the conception of Gini coefficient and used to evaluate the fairness levels of resource consumption and pollution releasing under the same economy contribution rate,and green contribute coefficient(GCC) was used to estimate the unfair factors of resource consumption and pollution releasing.
张音波等认为:资源环境基尼系数是用来反映在"经济贡献率"相同的情况下,资源消耗、污染物排放公平程度的一个指标,并用"绿色贡献系数"来判断资源消耗与污染物排放的不公平因子。
4) economy-environment Gini coefficient


经济-环境基尼系数
5) Gini coefficient


基尼系数
1.
Analysis of city resource-environment Gini coefficient in Guangdong Province;


广东省城市资源环境基尼系数
2.
Analysis of China resource-environment Gini coefficient based on GDP.;


基于GDP的中国资源环境基尼系数分析
3.
The evolvement of carrying capacity of water source in karst regions based on Gini coefficient and gray analysis;
基于基尼系数的岩溶地区水资源承载力演化的灰色分析——以贵州省为例
6) gini-coefficient


基尼系数
1.
Rural-Urban Migration and Income Inequality:A Theory based on Gini-Coefficient;


城乡移民与收入不平等:基于基尼系数的理论分析
2.
This paper,by examining the change of “population-GDP” gini-coefficient before and after the population migration of the provinces during 1985-2000,validates that population migration can mitigate the unbalanced de-velopment of regional economy.
本文通过测算我国1985-2000年各省区在人口迁移前后“人口—GDP”的基尼系数变化,验证了人口迁移对区域经济发展不均衡的减缓作用。
3.
Using the primacy law,the Gini-coefficient and the rank-size law to analyze size structure of urban system for 1986,1993,2000,2004.
使用首位律、基尼系数及位序-规模分布律的方法对中原城市群1986,1993,2000,2004年4个时间段的城市体系规模级别进行了分析处理,结果显示,中原城市群的城市首位度不够,离散化程度日益明显,城市规模结构达不到位序-规模分布的理想状态,但有逐渐改善的趋势。
补充资料:基尼系数
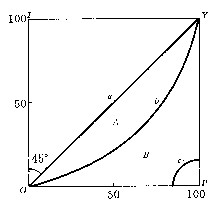
| 基尼系数 Gini coefficient 西方经济 学中用来判断社会收入分配平均程度的指标。由20世纪初意大利经济学家C.基尼设立而得名。由于基尼是根据洛伦茨曲线图而设立此指标,基尼系数又称洛伦茨系数。 洛伦茨曲线图如下:
图中,OI表示收入百分比,OP 表示人口百分比。联结两对角的直线(45°线)是绝对平均曲线(a ),线上任何一点到OI轴和OP轴的距离都相等, 并表示:总人口中每一定百分比的人口所拥有的收入,在总收入中也占一定的百分比。OPY线是绝对不平均曲线(c ),它表示:社会成员中,除一人外 ,其余人的收入都是零, 这最后一人得到全部收入。实际收入分配曲线(b ), 一般介于绝对平均曲线和绝对不平均曲线之间,这条线上,除起点(O )和终点(Y)以外,任何一点与两轴的距离都不相等,这表明:总人口中每一定百分比的人口所拥有的收入,在总收入中占一个不等的百分比。实际收入分配曲线与绝对平均曲线越近,社会收入分配越平均;反之,两条曲线间的距离越大,社会收入越不平均。 在图中,A表示实际收入分配曲线与绝对平均曲线之间的面积 ;B表示实际收入分配曲线与绝对不平均曲线之间的面积。  。如果A等于零,基尼系数为零,收入绝对平均;如果B等于0,基尼系数为1 ,收入绝对不平均。 基尼系数一般在0与1之间。基尼系数越小,收入越平均。 。如果A等于零,基尼系数为零,收入绝对平均;如果B等于0,基尼系数为1 ,收入绝对不平均。 基尼系数一般在0与1之间。基尼系数越小,收入越平均。洛伦茨曲线和基尼系数也常用来分析财产分配的平均程度。 |
说明:补充资料仅用于学习参考,请勿用于其它任何用途。
参考词条
