2) satellite dada assimilation

卫星资料直接同化
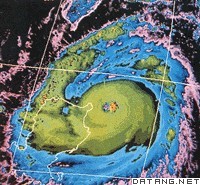
3) satellite cloud image
卫星云图
1.
3-D visualization simulation technology of spatial-based satellite cloud images;
基于空间的卫星云图三维可视化仿真技术研究
2.
Using the method of mathematical morphology,this paper fulfills filtration,segmentation and extraction of morphological features of the satellite cloud image.
用数学形态学的方法实现对卫星云图的滤波、分割和形态特征提取,并提出基于Transputer并行网络的有关算法。
3.
The characteristics of hail cloud echoes,velocity echoes and satellite cloud images are obtained.
针对2005年5月30日甘肃区域性罕见冰雹天气过程,结合天气实况、环流形势以及环境场特征,利用卫星云图和新一代天气雷达产品资料,分析了这次强冰雹天气过程的影响系统、云图和雷达回波演变过程,得到了冰雹云在雷达强度回波、速度回波和卫星云图中的特征,揭示了这次强冰雹不是带状冰雹云系移到本地产生的,而是发展成中β尺度(MβCS)的中尺度对流系统造成的。
4) satellite cloud picture
卫星云图
1.
On the basis of the characteristics of satellite cloud picture, this paper gives one automatic classification method of satellite cloud image:Iterative Self Organizing Data Analysis Techniques Algorithm (ISODATA).
根据数字化气象卫星资料的特点,设计了对卫星云图进行自动分类识别的动态聚类算法。
2.
The combined analysis of the weather map, satellite cloud picture and V 3θ chart can not only reflect the southern frontal weather process clearly, but also increase the effect of the forecast of the frontal rainfall point and the rainfall volume and terminating time.
天气图、卫星云图和V -3θ图结合分析不仅能清晰反映锋面天气过程 ,而且能够提高降水落点、降水强度及降水结束时间的预测效果。
3.
1 strongest typhoon named "pearl" in 2006 and employing global model products of European digital forecast center of MICAPS system-climate information synthetic analyzing processing system and global model products of Japanese,Washington,and T213 digital forecasting products,satellite cloud picture etc.
通过对2006年第1号强台风"珍珠"过程分析入手,运用MICAPS系统——气象信息综合分析处理系统中的欧洲数值预报中心、日本、美国华盛顿的全球模式产品,以及T213数值预报产品、卫星云图等方法,对该典型的强台风过程进行探讨,归纳其发生发展过程中的特点,探索其演变规律,总结台风过程的预报工作思路和经验,以提高预报台风的能力,确保飞行安全。
5) satellite image
卫星云图
1.
The Study on the Method of Typhoon Satellite Image Segmentation;
台风卫星云图分割方法研究
2.
Characteristic analysis of satellite images of severe convective weather (thunderstorm) in southeast coast region;
东南沿海地区强对流天气(雷暴)卫星云图特征分析
3.
Contented Based Cloudy Satellite Images Retrieval System Design and Practice;
基于内容的卫星云图检索系统设计与实现
6) satellite imagery
卫星云图
1.
Algorithm based on match in automatic inching orientation in satellite imagery;
基于匹配法的卫星云图自动定位微调算法
2.
The system includes ten parts: the satellite data mapper, the satellite data processor, identification of satellite imagery, estimation of rainfall, cloud motion estimation, weather chart superposition, view of weather observations, analysis of route weather, demonstration of cartoon and satellite imagery print.
简要介绍利用GMS-5云图资料研制的《卫星云图综合分析业务系统》,系统在静止卫星资料定量应用方面做了一些有益的工作。
3.
A digital system for processing GMS—LR—Fax satellite imagery is described, which is designed by using the PC/AT microcomputer, with focus on the discussion of data sampling and a few operational problems.
介绍在PC/AT微机上开发设计的GMS—LR—FAX卫星云图数字化处理系统,着重讨论数据采样和若干业务化问题。
补充资料:卫星云图
| 卫星云图 satellite cloud imagery 由气象卫星自上而下观测到的地球上的云层覆盖和地表面特征的图像。利用卫星云图可以识别不同的天气系统,确定它们的位置,估计其强度和发展趋势,为天气分析和天气预报提供依据。在海洋、沙漠、高原等缺少气象观测台站的地区,卫星云图所提供的资料,弥补了常规探测资料的不足,对提高预报准确率起了重要作用。
根据卫星上仪器装置的不同,卫星云图可以分成两类:一类是由卫星上电视照相机所拍摄的云图,即电视云图;另一类是由辐射仪对地球大气进行扫描探测得到的云图。在电视云图上,图像的黑白程度表示地表面和各类云对太阳辐射的反射率强弱,白色表示反射率最强,黑色表示反射率最弱。扫描辐射仪探测到的卫星云图又分两种:①用辐射仪测量云和不同性质地表面对太阳辐射可见光的某一波段(如0.52~0.73微米)反射辐射强度时,可以得到一张与电视云图相似的云图。这种云图与电视云图一起,统称作可见光云图。②用辐射仪测量在大气窗区波段(8.5~11微米)来自云顶或地表面放射的红外辐射。这种观测值可以转换成云顶或地表面的辐射温度,用黑白层次表示温度的高低,由此得到一张由云和不同性质地表面的分布图像,称作红外云图。 图像资料的分辨率高低是衡量卫星云图质量高低的重要指标。按照卫星上电视照相机的精度和扫描辐射仪观测的瞬时视场大小,分成低分辨率和高分率辨云图两种。分辨率高,云中细小结构能表示出来。 |
说明:补充资料仅用于学习参考,请勿用于其它任何用途。
参考词条