2) generalized supervisor calls trail

通用管理程序调用跟踪
3) track-debugging
跟踪调试
1.
The component of track-debugging for component Operation System(OS),which has both logic debugging function and performance debugging function,is proposed in this paper.
为了适应分布式构建化操作系统对性能调试的需求,采用了对构件化对象建立日志服务和增加构件化系统调用对进程的访问控制的方法,从而为构件化操作系统设计出一种兼具逻辑性调试和性能调试功能的跟踪调试构件。
4) Follow-up Investigation
跟踪调查
1.
Report on Follow-up Investigation Analysis about the Graduates of the Human Resources Management Major;
人力资源管理专业毕业生跟踪调查分析报告
2.
Thinking about perfecting evaluation index system for graduate quality follow-up investigation ——Based on investigation results for graduates of SIE in recent years
关于完善毕业生质量跟踪调查评价指标体系的思考——基于对沈阳工程学院毕业生的调查结果
5) tracking focusing
跟踪调焦
补充资料:Pro/E中快速调用外部程序
当我们在使用proe进行设计时,难免会使用一些外部的应用程序
通常我们都会把proe最小化到桌面后去寻找所需要的次序、或者在Windows的程序组中寻找 这样比较不方便。
其实利用proe的mapkey功能就可以解决这个问题,下面以使用计算器为例
首先,建立一个bat文件,编辑以下内容:
@echo off
REM Start Calculator
set C:\WINNT\SYSTEM32
start calc.exe
exit
然后在proe中打开Environment > Mapkeys > New
如下图的操作
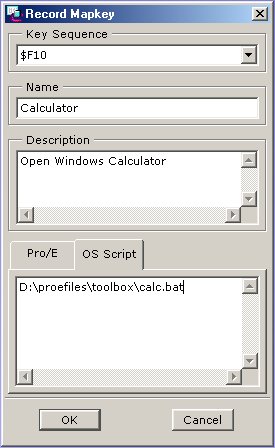
保存后就可以在proe中以快捷键F10打开Windows的计算器程序了
依次类推可以其他的快捷键打开任意应用程序。
说明:补充资料仅用于学习参考,请勿用于其它任何用途。
参考词条