1) Gini coefficient between-groups

群体间基尼系数
2) Gini coefficient within-groups
群体内基尼系数
1.
Graphical analysis is used to illustrate the process of decomposition be tween-groups and within-groups, and then application of Gini coefficient between groups and addictively decomposition of Gini coefficient within-groups are discussed.
本文通过几何分解的方法阐述了基尼系数在不同群体中进行分解的过 程,并在此基础上对群体间基尼系数的应用和群体内基尼系数的进一步分解进行了 讨论。
3) spatial Gini coefficient
空间基尼系数
1.
This paper, based on the detail statistical material and using location quotient and spatial Gini coefficient, makes a deep research on the structure and spatial distribution of different service industries of the Yangtze River Delta with different districts from the angle of output value, unit and employment.
文章利用较为详实的统计资料,从服务业产值、单位和从业人员行业分布的角度,运用区位指数和空间基尼系数,基于功能性划分的服务业部门对长三角服务业结构和空间布局做了深入的研究。
2.
The paper calculates the congregation degree of regional concentration and regional distribution of the sub-class of animal husbandry industry in Chinese tradional plain agricultural areas by using the means of location index and the spatial gini coefficient.
本文利用区位商指数和空间基尼系数,分析了我国传统平原农区畜牧业各子类产业的区域集聚分布情况和区域集聚程度。
5) Gini coefficient
基尼系数
1.
Analysis of city resource-environment Gini coefficient in Guangdong Province;
广东省城市资源环境基尼系数
2.
Analysis of China resource-environment Gini coefficient based on GDP.;
基于GDP的中国资源环境基尼系数分析
3.
The evolvement of carrying capacity of water source in karst regions based on Gini coefficient and gray analysis;
基于基尼系数的岩溶地区水资源承载力演化的灰色分析——以贵州省为例
6) gini-coefficient
基尼系数
1.
Rural-Urban Migration and Income Inequality:A Theory based on Gini-Coefficient;
城乡移民与收入不平等:基于基尼系数的理论分析
2.
This paper,by examining the change of “population-GDP” gini-coefficient before and after the population migration of the provinces during 1985-2000,validates that population migration can mitigate the unbalanced de-velopment of regional economy.
本文通过测算我国1985-2000年各省区在人口迁移前后“人口—GDP”的基尼系数变化,验证了人口迁移对区域经济发展不均衡的减缓作用。
3.
Using the primacy law,the Gini-coefficient and the rank-size law to analyze size structure of urban system for 1986,1993,2000,2004.
使用首位律、基尼系数及位序-规模分布律的方法对中原城市群1986,1993,2000,2004年4个时间段的城市体系规模级别进行了分析处理,结果显示,中原城市群的城市首位度不够,离散化程度日益明显,城市规模结构达不到位序-规模分布的理想状态,但有逐渐改善的趋势。
补充资料:基尼系数
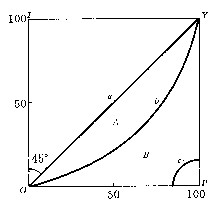
| 基尼系数 Gini coefficient 西方经济 学中用来判断社会收入分配平均程度的指标。由20世纪初意大利经济学家C.基尼设立而得名。由于基尼是根据洛伦茨曲线图而设立此指标,基尼系数又称洛伦茨系数。 洛伦茨曲线图如下:
图中,OI表示收入百分比,OP 表示人口百分比。联结两对角的直线(45°线)是绝对平均曲线(a ),线上任何一点到OI轴和OP轴的距离都相等, 并表示:总人口中每一定百分比的人口所拥有的收入,在总收入中也占一定的百分比。OPY线是绝对不平均曲线(c ),它表示:社会成员中,除一人外 ,其余人的收入都是零, 这最后一人得到全部收入。实际收入分配曲线(b ), 一般介于绝对平均曲线和绝对不平均曲线之间,这条线上,除起点(O )和终点(Y)以外,任何一点与两轴的距离都不相等,这表明:总人口中每一定百分比的人口所拥有的收入,在总收入中占一个不等的百分比。实际收入分配曲线与绝对平均曲线越近,社会收入分配越平均;反之,两条曲线间的距离越大,社会收入越不平均。 在图中,A表示实际收入分配曲线与绝对平均曲线之间的面积 ;B表示实际收入分配曲线与绝对不平均曲线之间的面积。  。如果A等于零,基尼系数为零,收入绝对平均;如果B等于0,基尼系数为1 ,收入绝对不平均。 基尼系数一般在0与1之间。基尼系数越小,收入越平均。 。如果A等于零,基尼系数为零,收入绝对平均;如果B等于0,基尼系数为1 ,收入绝对不平均。 基尼系数一般在0与1之间。基尼系数越小,收入越平均。洛伦茨曲线和基尼系数也常用来分析财产分配的平均程度。 |
说明:补充资料仅用于学习参考,请勿用于其它任何用途。
参考词条