|
|
|
说明:双击或选中下面任意单词,将显示该词的音标、读音、翻译等;选中中文或多个词,将显示翻译。
|
|
|
1) J functional curves

"J"函数曲线
2) function curve
函数曲线
1.
There is not the command of drawing function curve in AutoCAD.
针对A u toCAD使用过程中没有函数曲线绘制命令的问题,给出了在A u toCAD中绘制函数曲线的两种方法,对于A u toCAD的使用及二次开发具有一定的参考价值。
2.
Selecting Visual Basic language as the developing tool, this paper takes common sine signal waves as an example to discuss the dynamic making of function curves.
选用VisualBasic语言为开发工具 ,以常用的正弦信号波形为例探讨CAI课件中函数曲线动态制
3.
This article introduces with samples the principles and methods in applying Authorware software to make function curve.
该文通过实例介绍了如何利用该软件制作数学课件中函数曲线的原理及方法。
3) yarn end curve
曲线函数
4) J function
J函数
1.
(Ripley s) L) function and J function,to analyze the spatial point pattern and marked point pattern of Nitraria tangutorum shrub islands for 3 samples in 3 different towns(Duguitala,Huhemudu and Balagong).
采用Ripley sK函数(L函数)和J函数对研究区内典型样方的白刺灌丛沙包进行点格局和标记点格局分析。
5) Hyperbolic Function
双曲线函数
1.
The load-settlement relationship of skin friction q of every part of squeezed branch and corresponding settlement s of plate pile is presupposed as hyperbolic function,the necessary parameters are obtained based on the measured data,and compared with q-s relationship of measured every part.
假定支盘桩直桩段的桩侧摩阻力和含有分支或承力盘桩段的等效侧摩阻力q与相应桩土相对位移s的关系可用双曲线函数表示,根据实测数据采用最小二乘法求出所需系数,并用所得的双曲线与实测各分段的q-s关系进行对比。
2.
According to the data statistics of max transformation aside of pit to time, the paper established 3 typical hyperbolic function of displacement to time (depth).
根据实测软土基坑坑侧最大位移与时间关系资料,经统计分析建立了3种有代表性的位移与时间(挖深)的双曲线函数。
3.
According to analysis of the behavior of sand surrounding pile tips,a hyperbolic function is presented considering the compressibility of soil around pile tip which establishes certain relation between end bearing capacity and penetration at pile base.
对桩端周围土体的性状进行了分析,引入考虑桩端土体压缩特性双曲线函数,将桩端阻力的发挥同桩的刺入变形联系起来。
6) convex functional curves
凸函数曲线
1.
A searching algorithm for the minimal value of convex functional curves and its applications in optimization;
一个凸函数曲线极值初始区间的搜索算法及其在优化中的应用
补充资料:Autocad VBA初级教程 (第五课 画函数曲线)
先画一组下图抛物线。 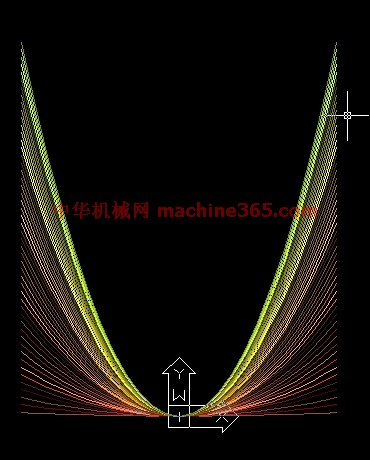
下面是源码:
Sub myl()
Dim p(0 To 49) As Double '定义点坐标
Dim myl As Object '定义引用曲线对象变量
co = 15 '定义颜色
For a = 0.01 To 1 Step 0.02 '开始循环画抛物线
For i = -24 To 24 Step 2 '开始画多段线
j = i + 24 '确定数组元素
p(j) = i '横坐标
p(j + 1) = a * p(j) * p(j) / 10 '纵坐标
Next i '至此p(0)-p(40)所有元素已定义,结束循环
Set myl = ThisDrawing.ModelSpace.AddLightWeightPolyline(p) '画多段线
myl.Color = co '设置颜色属性
co = co + 1 '改变颜色,供下次定义曲线颜色
Next a
End sub
为了鼓励大家积极思考,从本课开始,我不再解释每一条语句的作用,只对以前没有提过的语句进行一些解释,也许你一时很难明白,建议用上一课提到的跟踪变量、添加断点的办法领悟每一条语句的作用,如果有问题不懂请跟贴提问。
在跟踪变量p时请在跟踪窗口中单击变量p前的+号,这样可以看清数组p中每一个元素的变化。 ACAD没有现成的画抛物线命令,我们只能用程序编写多段线画近似抛物线。理论上,抛物线的X值可以是无限小、无限大,这里取值范围在正负24之间。 程序第二行:Dim myl As Object '定义引用曲线对象变量
Object也是一种变量类型,它可以把变量定义为对象,本例中myl变量将引用多段线,所以要定义为Objet类型。 看画多段线命令:
Set myl = ThisDrawing.ModelSpace.AddLightWeightPolyline(p) '画多段线
其中括号中的p是一个数组,这个数组的元素数必须是偶数,每两个元数作为一个点坐标。
等号前面部分“Set myl”的作用就将myl变量去引用画好的多段线。
myl.Color = co '设置颜色属性。在ACAD中,颜色可以用数字表示,本例中co会增值,这样就会有五彩缤纷的效果。 本课第二张图:正弦曲线,下面是源码:
Sub sinl()
Dim p(0 To 719) As Double '定义点坐标
For i = 0 To 718 Step 2 '开始画多段线
p(i) = i * 2 * 3.1415926535897 / 360 '横坐标
p(i + 1) = 2 * Sin(p(i)) '纵坐标
Next i
ThisDrawing.ModelSpace.AddLightWeightPolyline (p) '画多段线
ZoomExtents '显示整个图形
End Sub
说明:补充资料仅用于学习参考,请勿用于其它任何用途。
参考词条
|